Posts

HLT ideas

Image
HLT has reached its all time high at RM1.01 with fast pace due to the strong demand and sentiment for gloves all over the world due to Covid-19. There is a strong support at the fibonacci level of 0.382 where it was tested at RM0.66 twice and each time the price rebounded higher. The current price is at RM0.765 and no strong signal yet where it would go? Will it start an uptrend or downtrend to test the fibonacci level of 0.5 for a second time? What I notice is that the movement of HLT follows closely the momentum of Careplus. With careplus announcing private placement its price may pullback for a short while before moving upwards again. Will HLT follow suit?
RGT Berhad

Image
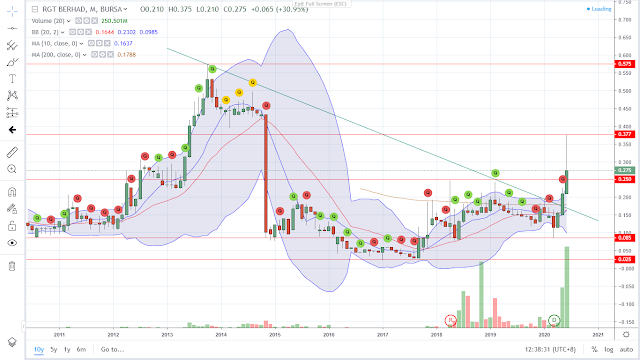
This is a 10 year chart for RGT Bhd based on a monthly basis. RGT Berhad's 10 year all time high is at 0.575 There is a breakout of downtrend line and it as tested a previous resistance at 0.375 with strong volume which is more than it previous volumes in a 10 year period. When we look at its 1 year chart, it actually gapped up upon breaking the downtrend line based on the previous 10 year chart. Last friday on 12 June when KLCI index gapped down and recovered following Dow Jones performance, it hit the  previous resistance which became a support at 0.25 and ended the day with a high of 0.275. It is still on an uptrend. Will it push further to test the resistance of 0.375 again?

Trading ideas. K1.

Image
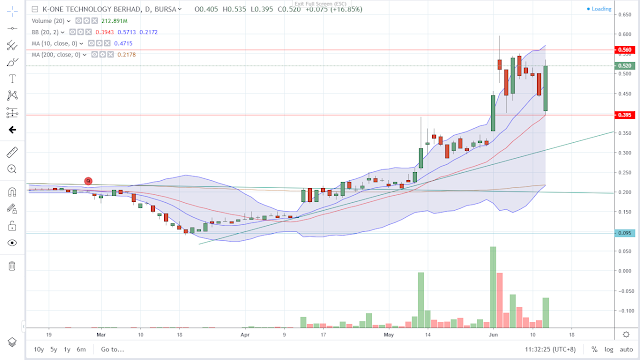
I've come to realise that I have to record my ideas, if I were to become a more successful trader. Hence this first post. K1 has reached it's lowest point at 0.095 which historically, was its lowest point in 10 years, which was tested in March, April and May of 2013. Ever since then, it has not looked back and has gone up to its current price of 0.52. K1 has a good potential to break a strong resistance at the price of 0.56, which was its previous all time high which was achieved back in 2015. It already broke the strong resistance on 2 Jun 2020 reaching a high or 0.595 but failed its breakout trend to end the day below the resistance at 0.51. Last Friday on 12 June when the KLCI index gapped down following Dow Jones performance, K1 hit and bounced off a strong support at 0.394/0.4 to end the day at a high of 0.52. It also created a Bullish Engulfing candle which may indicate a bullish trend. Will it be able to continue an uptrend to test the resistance and break