RGT Berhad

This is a 10 year chart for RGT Bhd based on a monthly basis. RGT Berhad's 10 year all time high is at 0.575
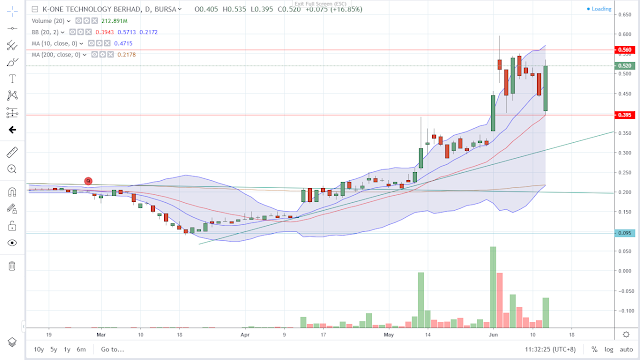
There is a breakout of downtrend line and it as tested a previous resistance at 0.375 with strong volume which is more than it previous volumes in a 10 year period.

When we look at its 1 year chart, it actually gapped up upon breaking the downtrend line based on the previous 10 year chart. Last friday on 12 June when KLCI index gapped down and recovered following Dow Jones performance, it hit the previous resistance which became a support at 0.25 and ended the day with a high of 0.275.
It is still on an uptrend. Will it push further to test the resistance of 0.375 again?

Comments
Post a Comment