Trading ideas. K1.

I've come to realise that I have to record my ideas, if I were to become a more successful trader. Hence this first post.
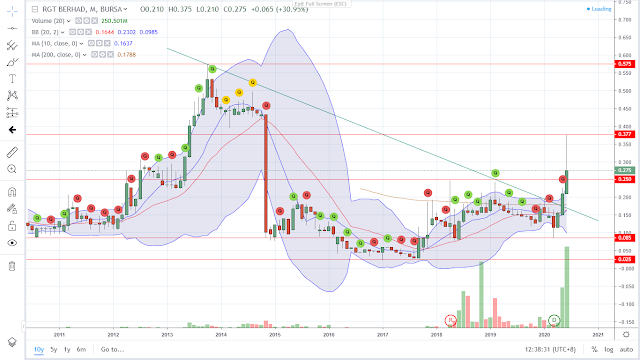
K1 has reached it's lowest point at 0.095 which historically, was its lowest point in 10 years, which was tested in March, April and May of 2013. Ever since then, it has not looked back and has gone up to its current price of 0.52.
K1 has a good potential to break a strong resistance at the price of 0.56, which was its previous all time high which was achieved back in 2015. It already broke the strong resistance on 2 Jun 2020 reaching a high or 0.595 but failed its breakout trend to end the day below the resistance at 0.51.
Last Friday on 12 June when the KLCI index gapped down following Dow Jones performance, K1 hit and bounced off a strong support at 0.394/0.4 to end the day at a high of 0.52.
It also created a Bullish Engulfing candle which may indicate a bullish trend.
Will it be able to continue an uptrend to test the resistance and break the strong resistance of 0.56? We shall wait and see.
Current price: 0.52
Resistance: 0.56
Support: 0.395-0.4

Comments
Post a Comment